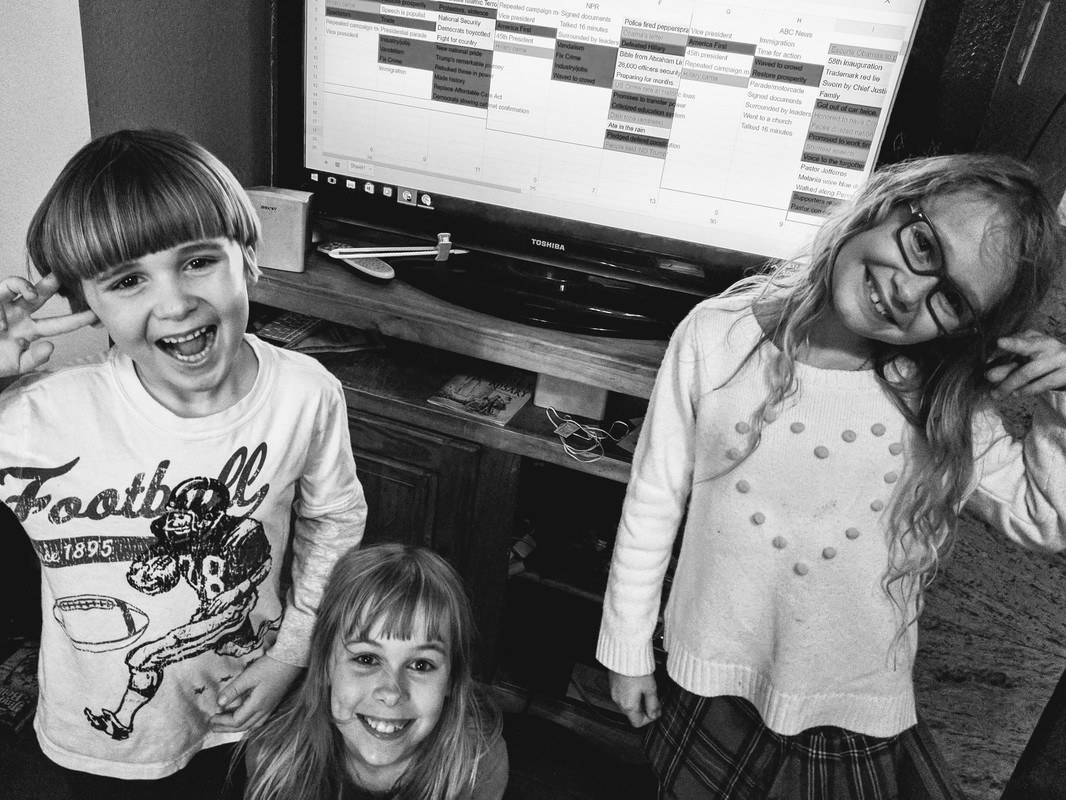
by Jason and the KidsI remember a time when news organizations were criticized for being biased. I mean, this was really a bad thing, and these networks fought the claim. But in the past year, most people will now accept that some media outlets are biased. Now, it's gone even farther. In the past year, terms such as "Fake News" and "Alternative Facts" have become so rampant that it has really lost its real meaning. I've seen "fake" posted on anything that someone personally doesn't trust, know about, or agree with, as a way to automatically discount any such information. We've gone from believing that a story may be biased to not believing it at all, and with no apparent regard for the qualifications, sources, or quality of the reporting. It would seem that many people cannot tell the difference between a headline, an editorial, and a rambling blog post, and therefore, all are treated equally...if it falls inline with my own personal opinion. I spent too many years in graduate school, and if I learned anything from writing pages and pages of thesis and dissertation proofs, it is that all information must be individually verifiable if it is to be considered as a scholarly publication. I also believe the same holds true for our news media - and I honestly believe that most are still credible in this nature. It is with this mindset that we decided to test this theory, and in the process, teach our kids how to trust, discriminate, and use modern news media to get a true story of what really happened. The presidential inauguration was upon us, so it was a perfect opportunity to use a very public event that many sources would report on. In our experiment, we gave our kids one of three 'headline' articles from major news outlets, and asked them to create a spider web of major points, details, and takeaways. 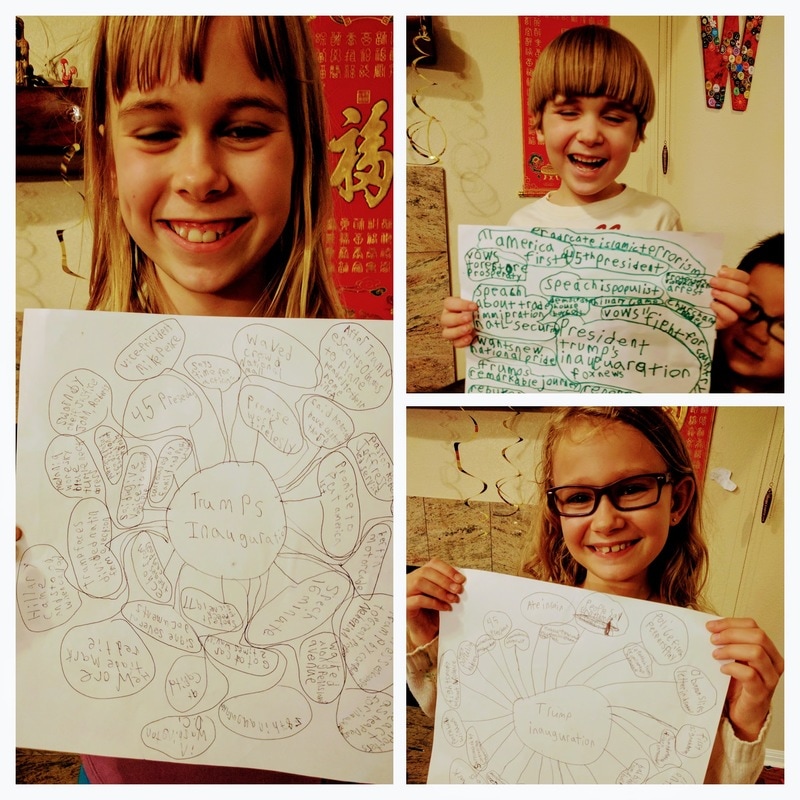 We then compared and contrasted each spider web, identifying the unique and duplicate bubbles from each news source. Together, we created a histogram of points which were unique, repeated in two sources, and common across all three sources. From this histogram, we could easily tell that two of the news sources had a higher ratio of 'unique' points. We explained that these weren't necessarily bad sources or points (or Fake), but that they alone may need to be verified with another sources if we were to trust them. However, having a source with many unique points was also a good thing, because it provided a unique perspective, and if you read many such articles, you can get a better idea of what really happened. It is, after all, these unique points that makes a story colorful or stand out. We then proceeded to color each point according to political bias - red/blue if it was biased (meaning that it painted one party in a better light), and blank if it was neutral or considered just a common fact. From this visualization, the kids immediately noticed that the organization with fewer unique points was also most biased in the points that it did publish. To our surprise, the other two stories were fairly balanced in biased points in both directions and in neutral points. Finally, we were able to identify general themes or impressions that each story gave to its readers - one was very descriptive, and another was notably holistic in explaining events surrounding the main story. What we learned from this exercise:
 Sources: NPR http://www.npr.org/2017/01/20/510746700/donald-trump-sworn-in-as-the-45th-president-of-the-united-states http://abcnews.go.com/Politics/inside-donald-trumps-inauguration-day/story?id=44906987 http://www.foxnews.com/politics/2017/01/20/president-trump-takes-office.html
0 Comments
Leave a Reply. |
On a MissionTwo passionate parents and their four children are excited to bring His Word to everyone in need while living a life of Gospel poverty as missionaries. They invite you to join them on a journey to encounter our global neighbors that Jesus commands us to love through works of charity and service. Archives
April 2021
Categories
All
|
 RSS Feed
